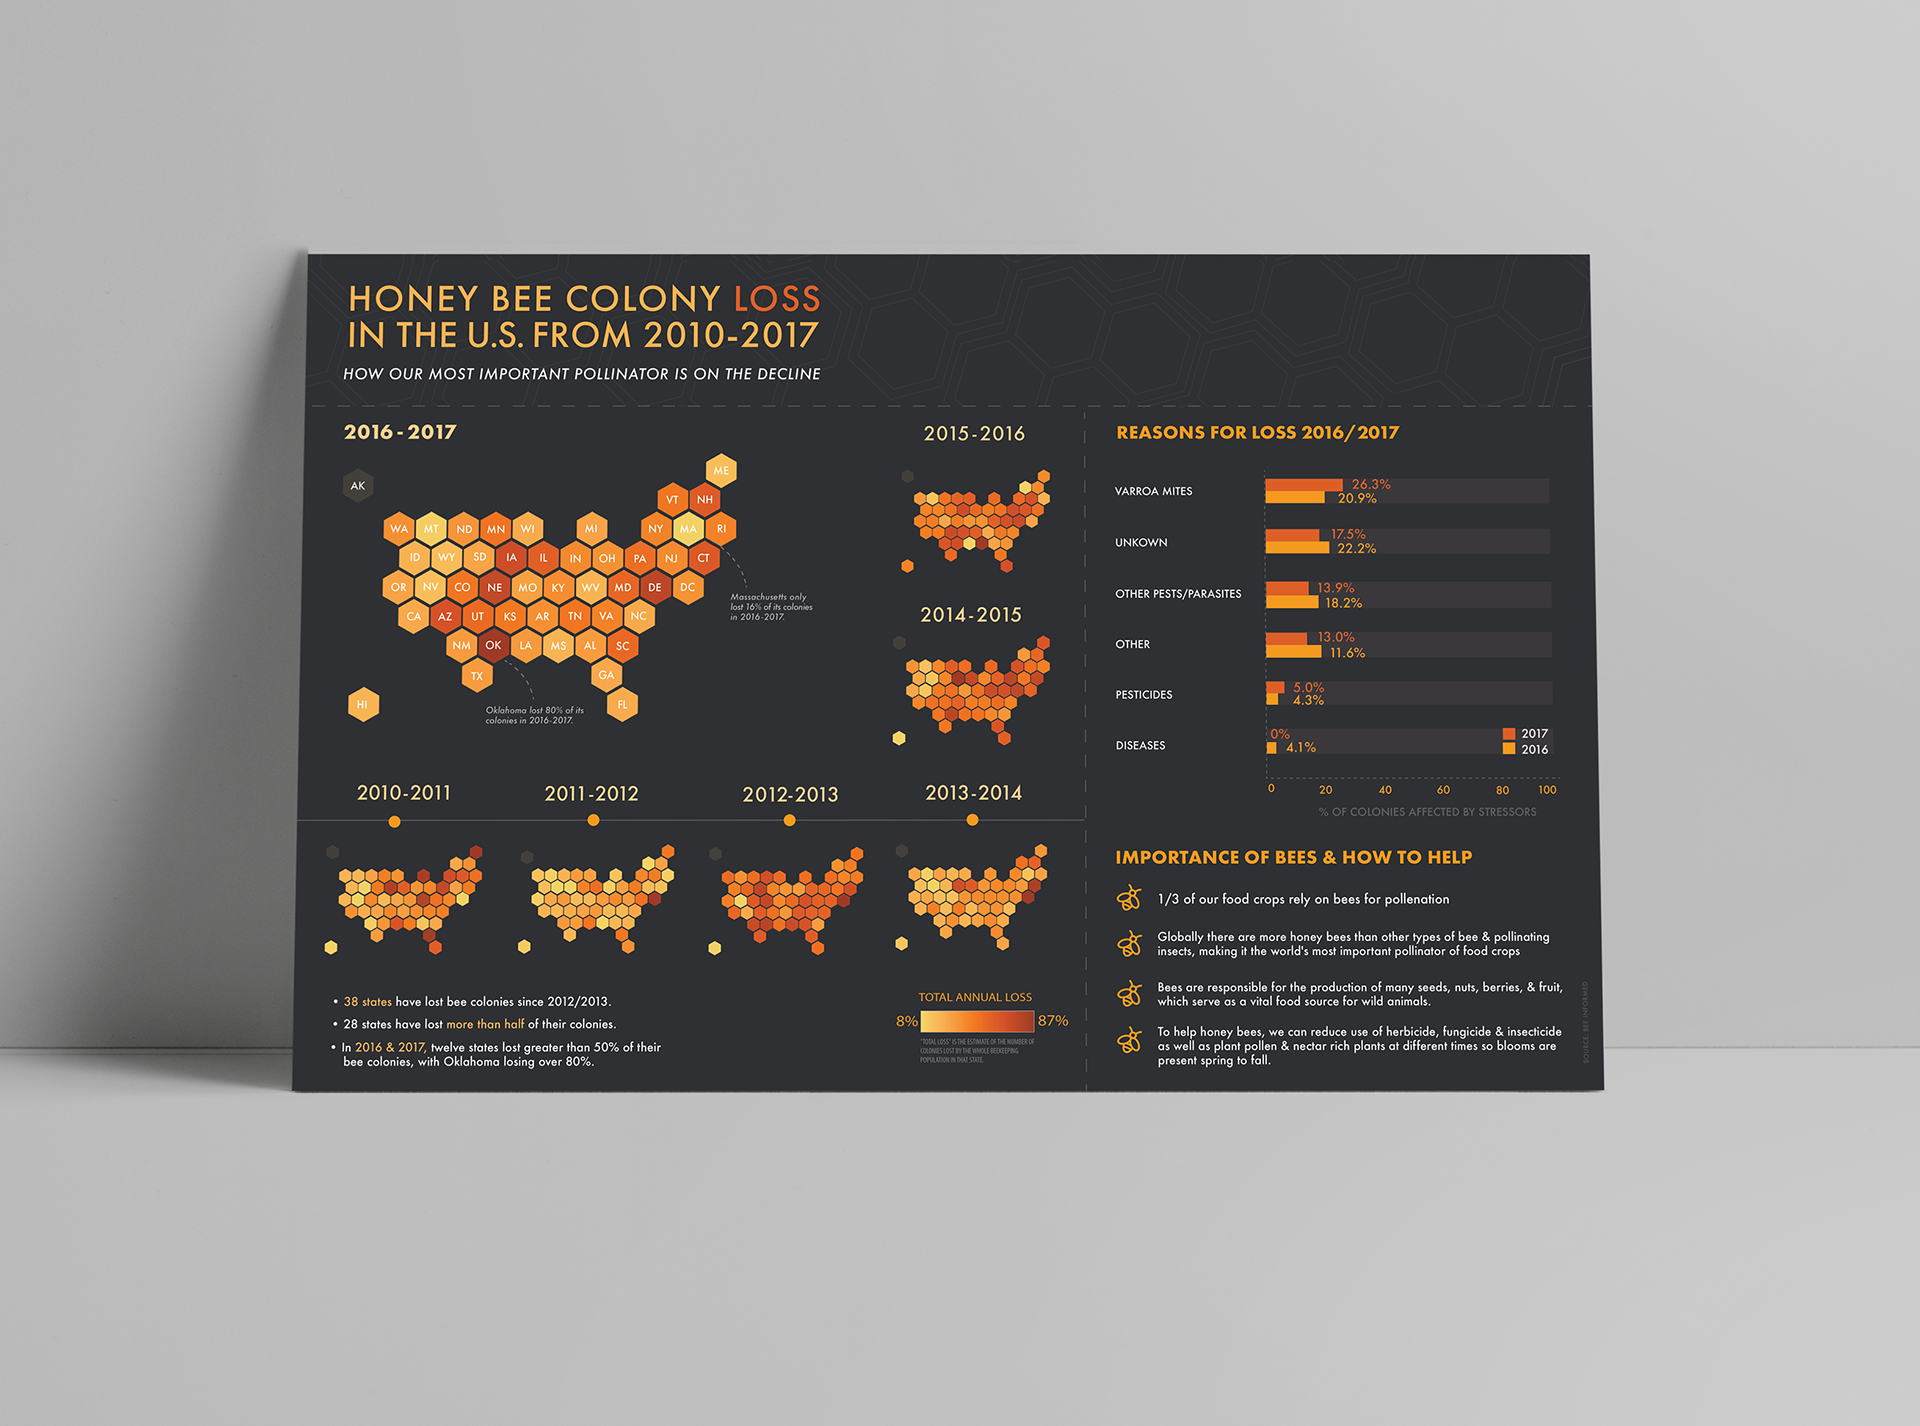
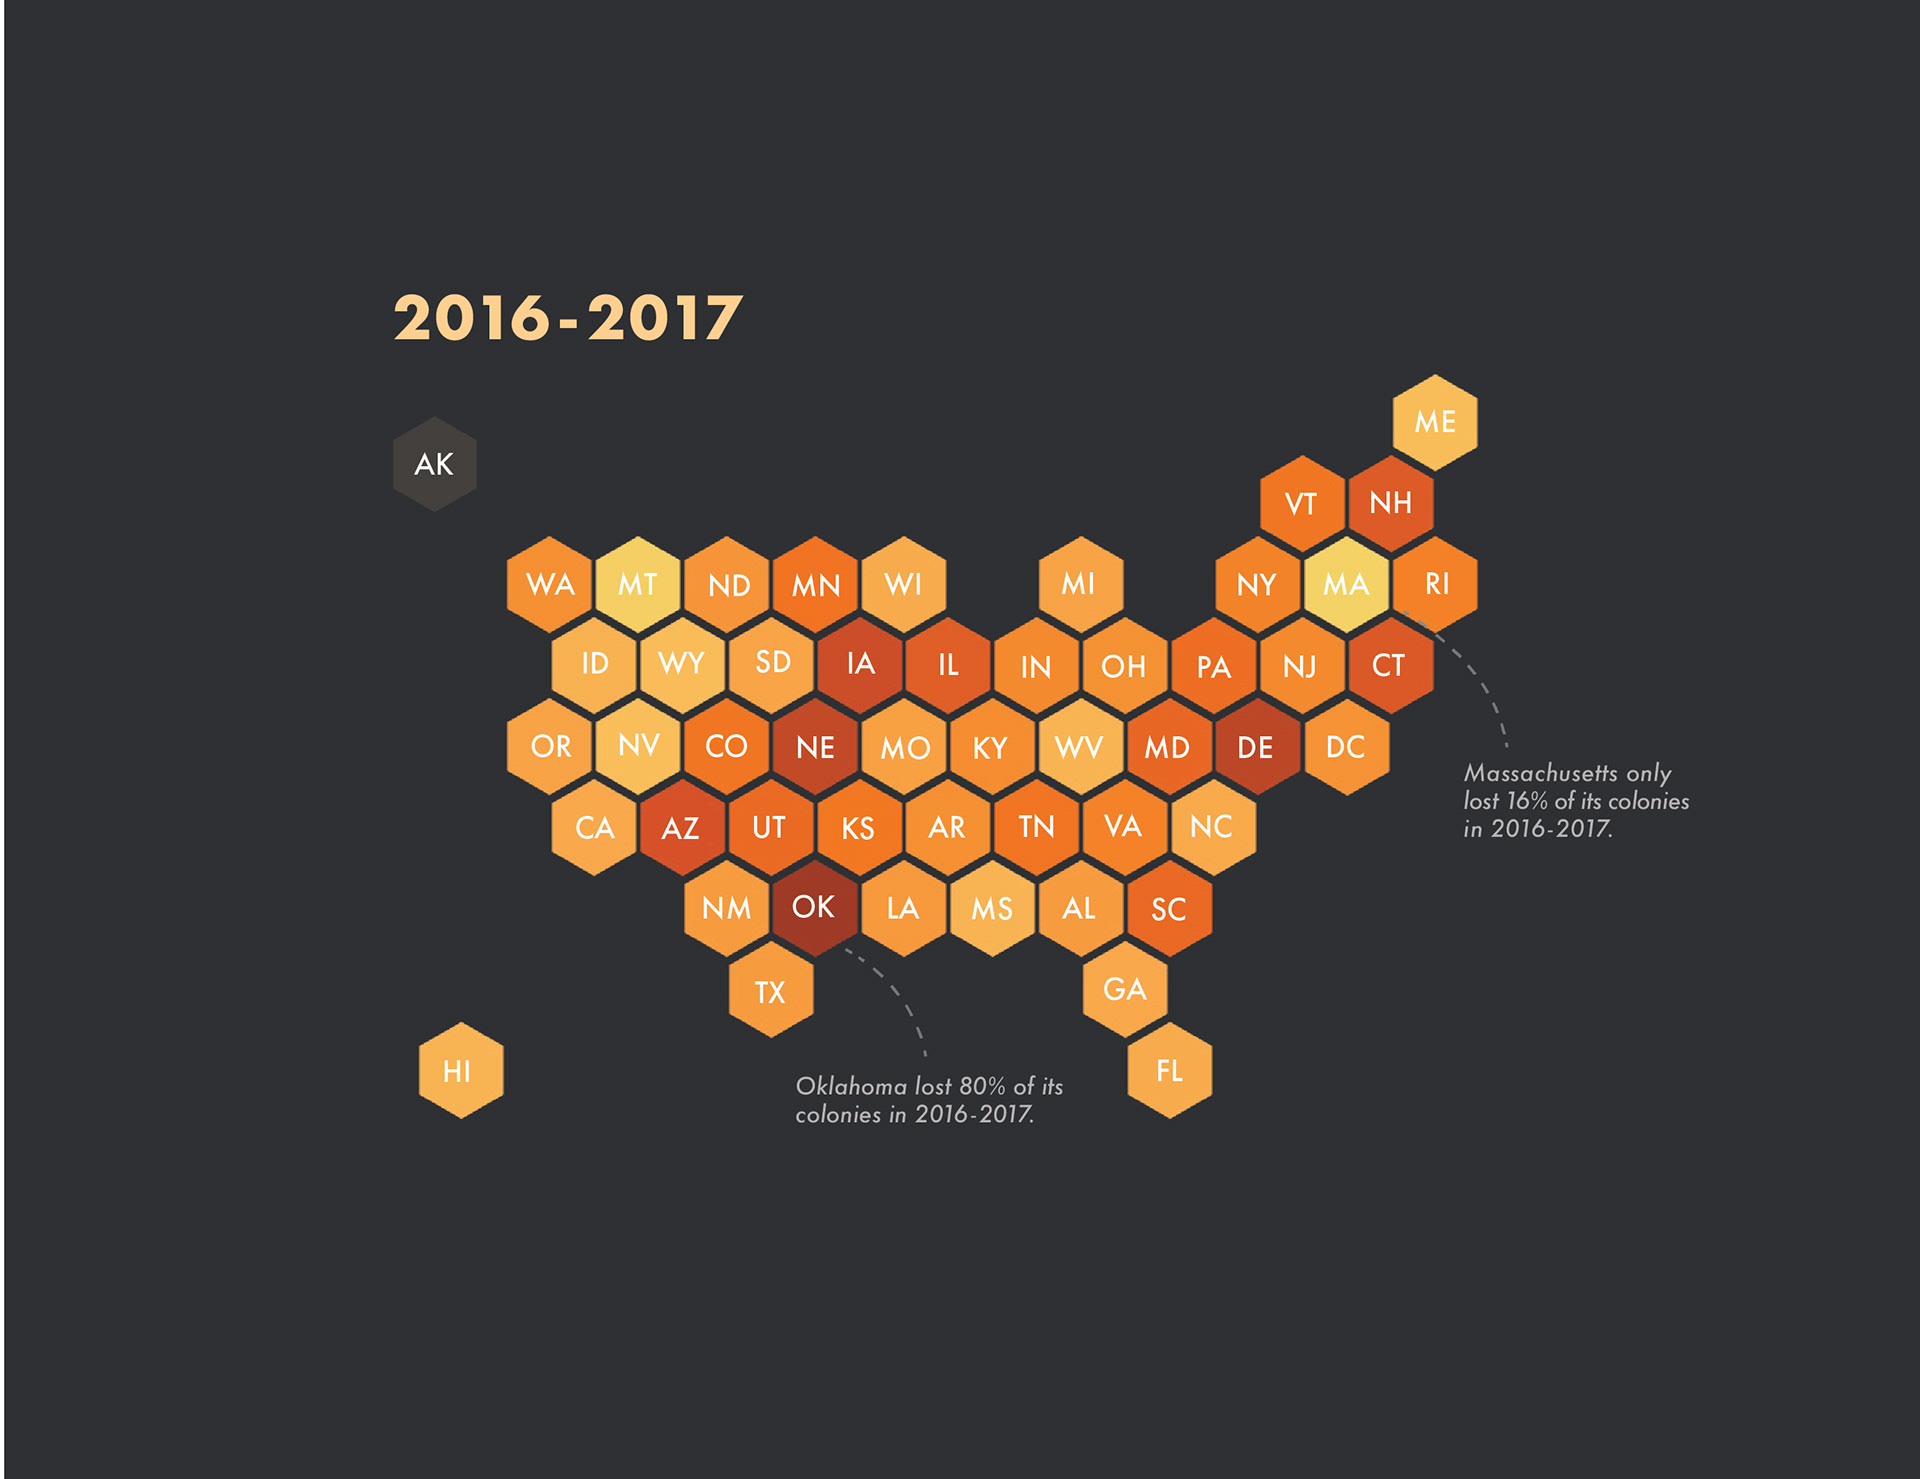
Interactive Tableau Dashboard Design
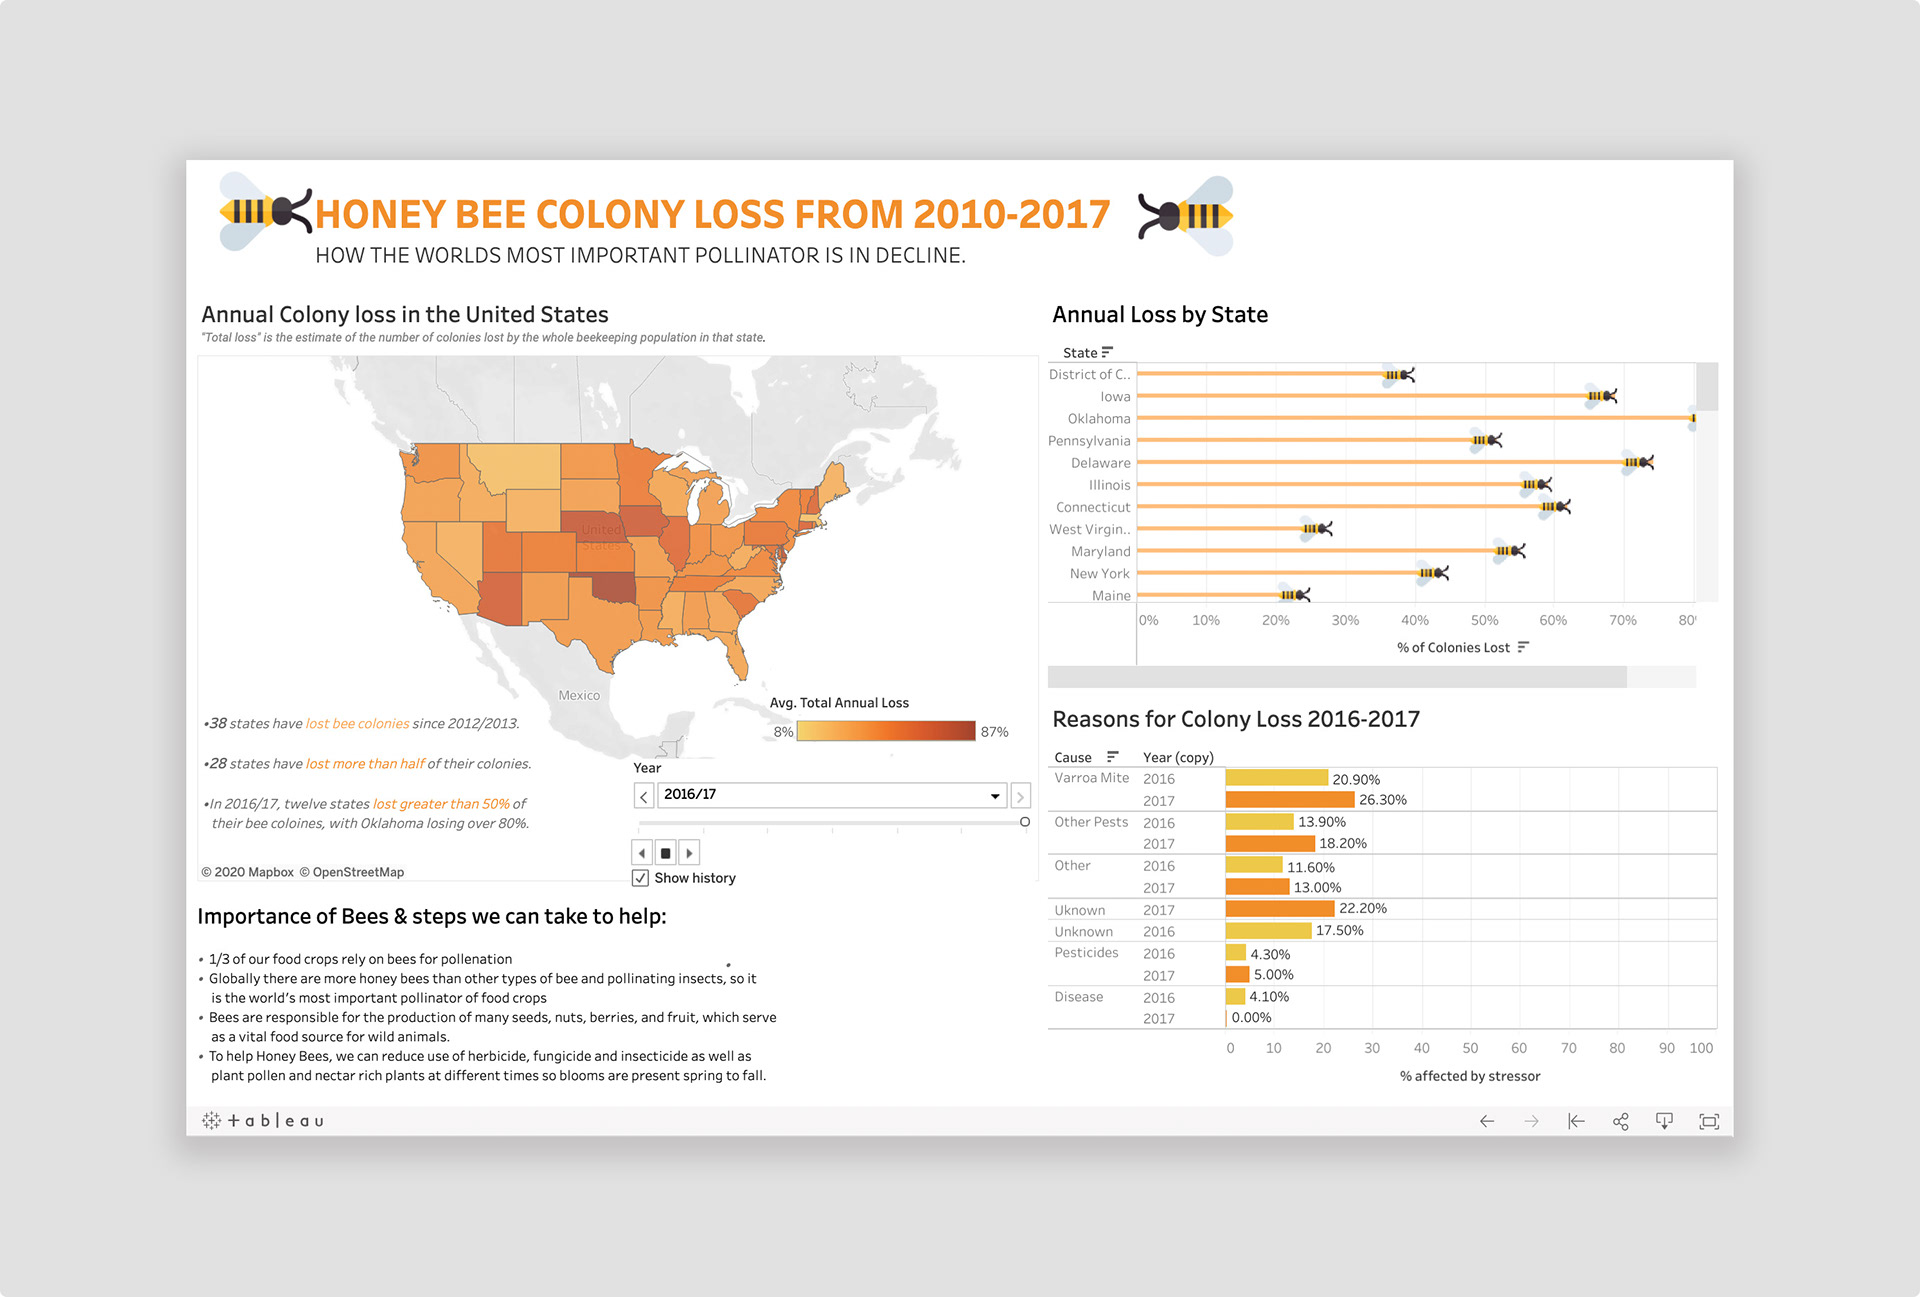
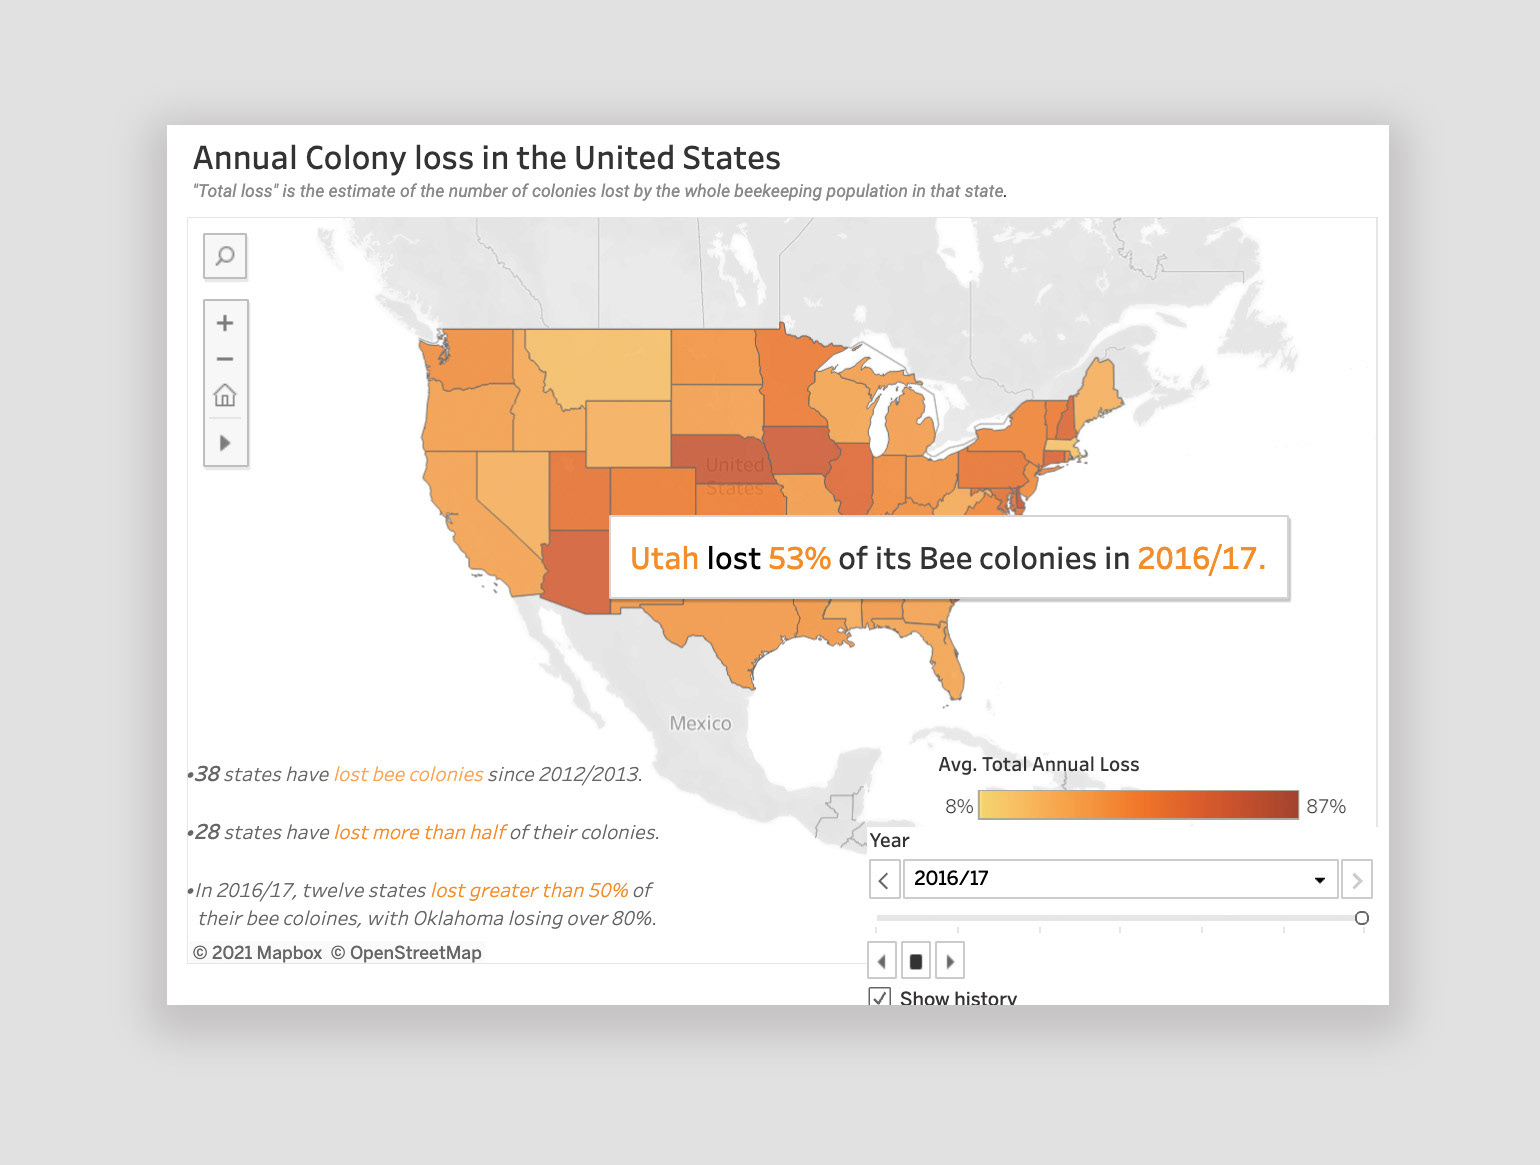
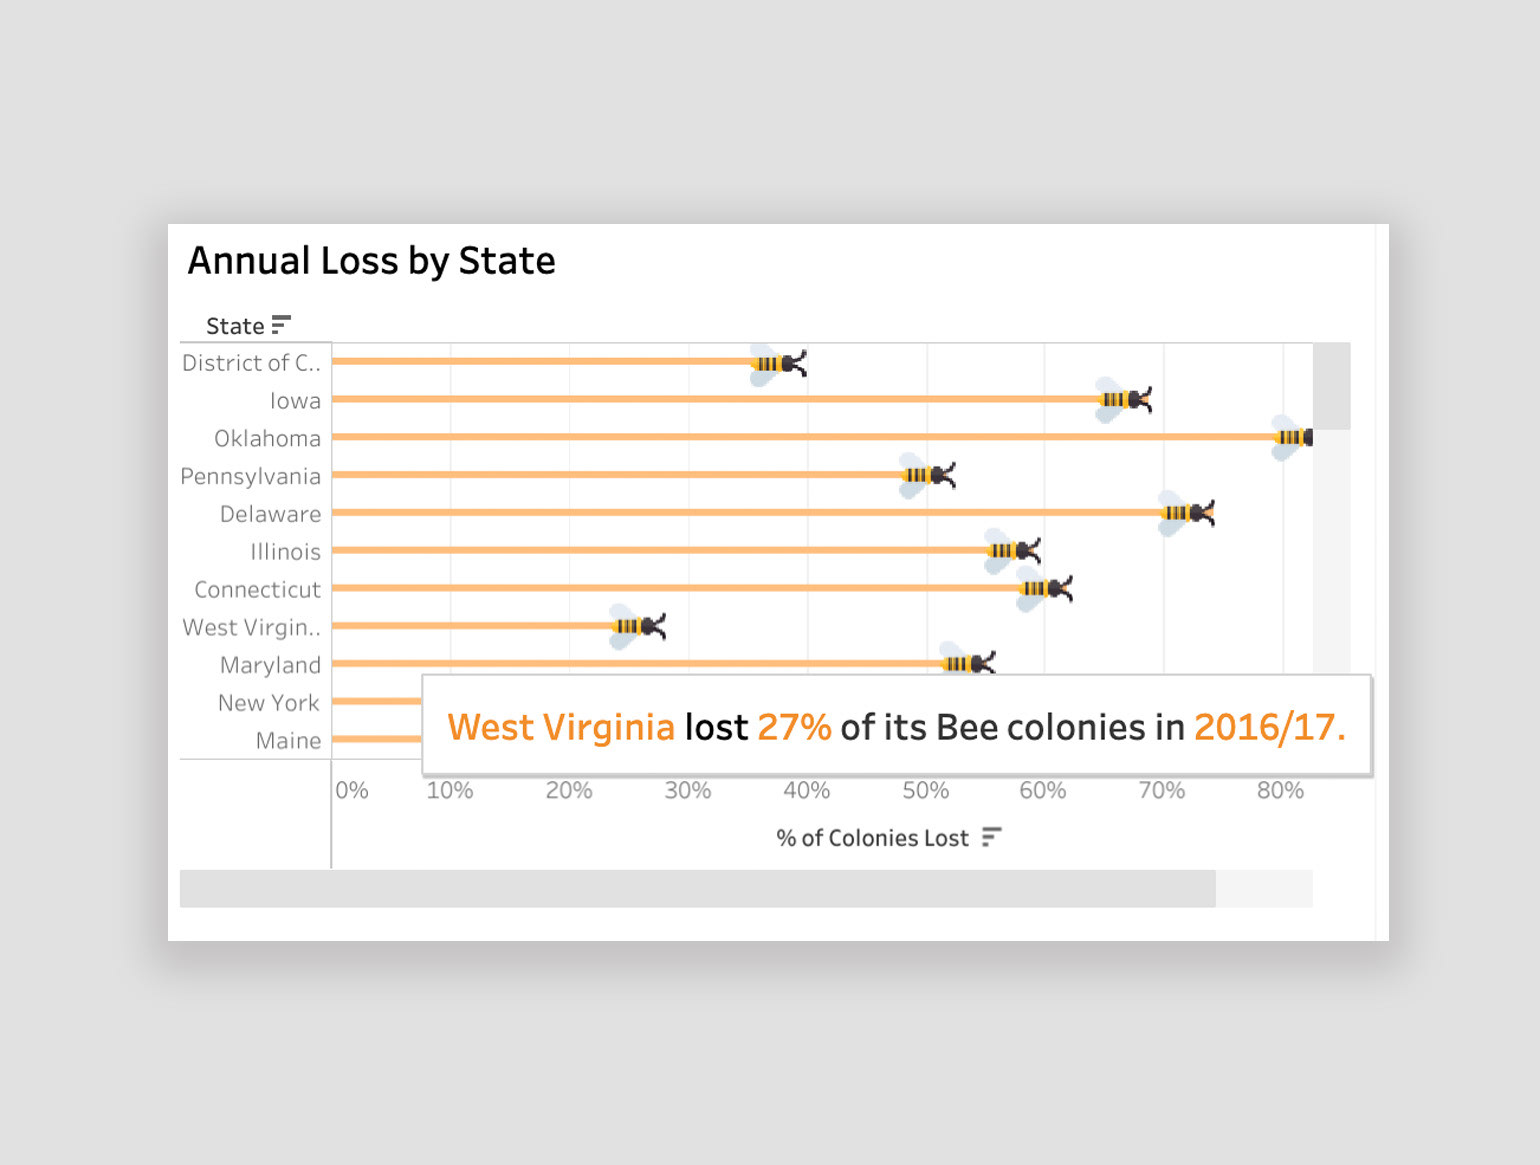
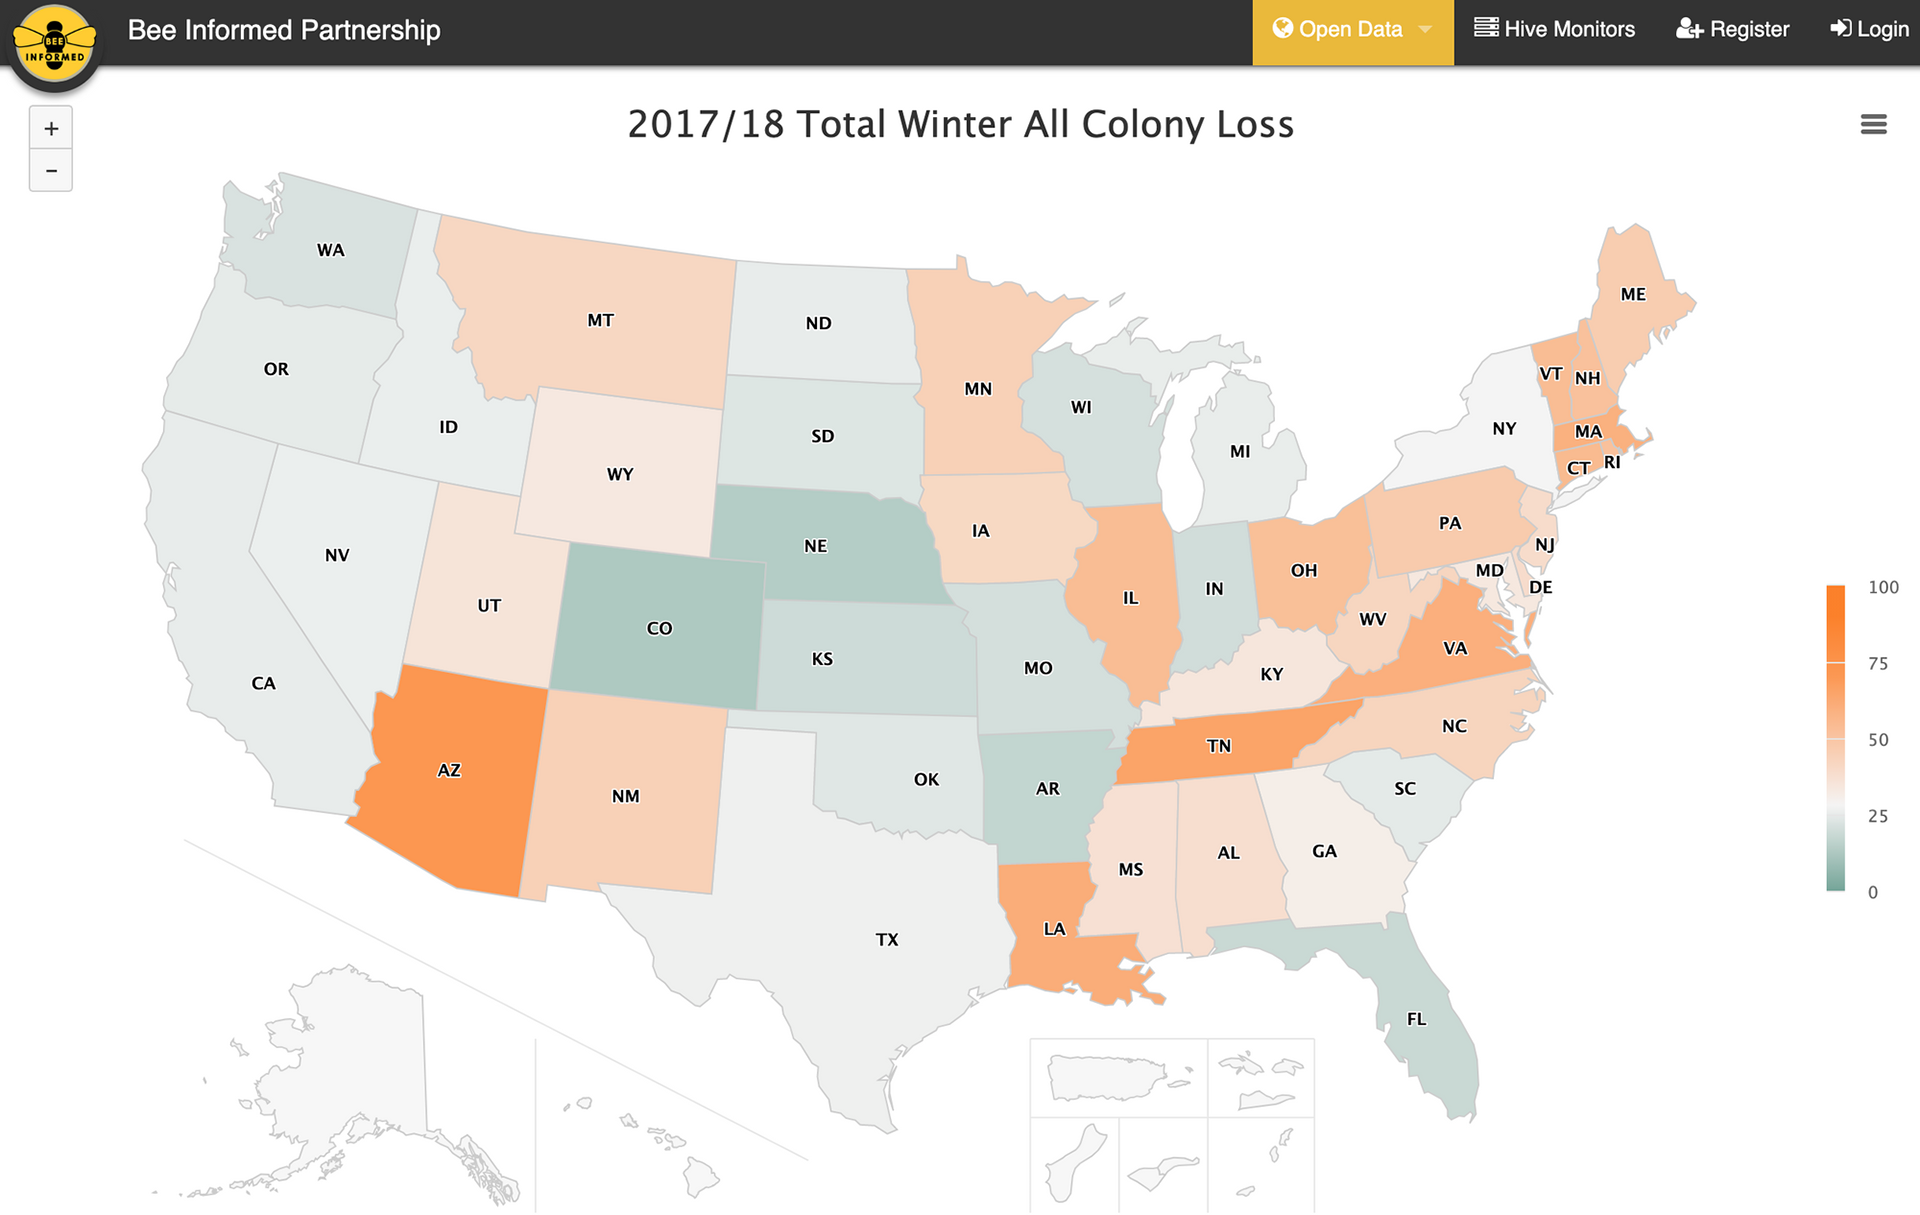
The interactive dashboard features filters and highlights to show trends in the data. Tooltips were an important part of the design in this dashboard and gave insight on data that was shown in the charts and map. The Tableau repository was utilized to incorporate icons of the bees and were intended to personify the insect and allow the subject to come to life.
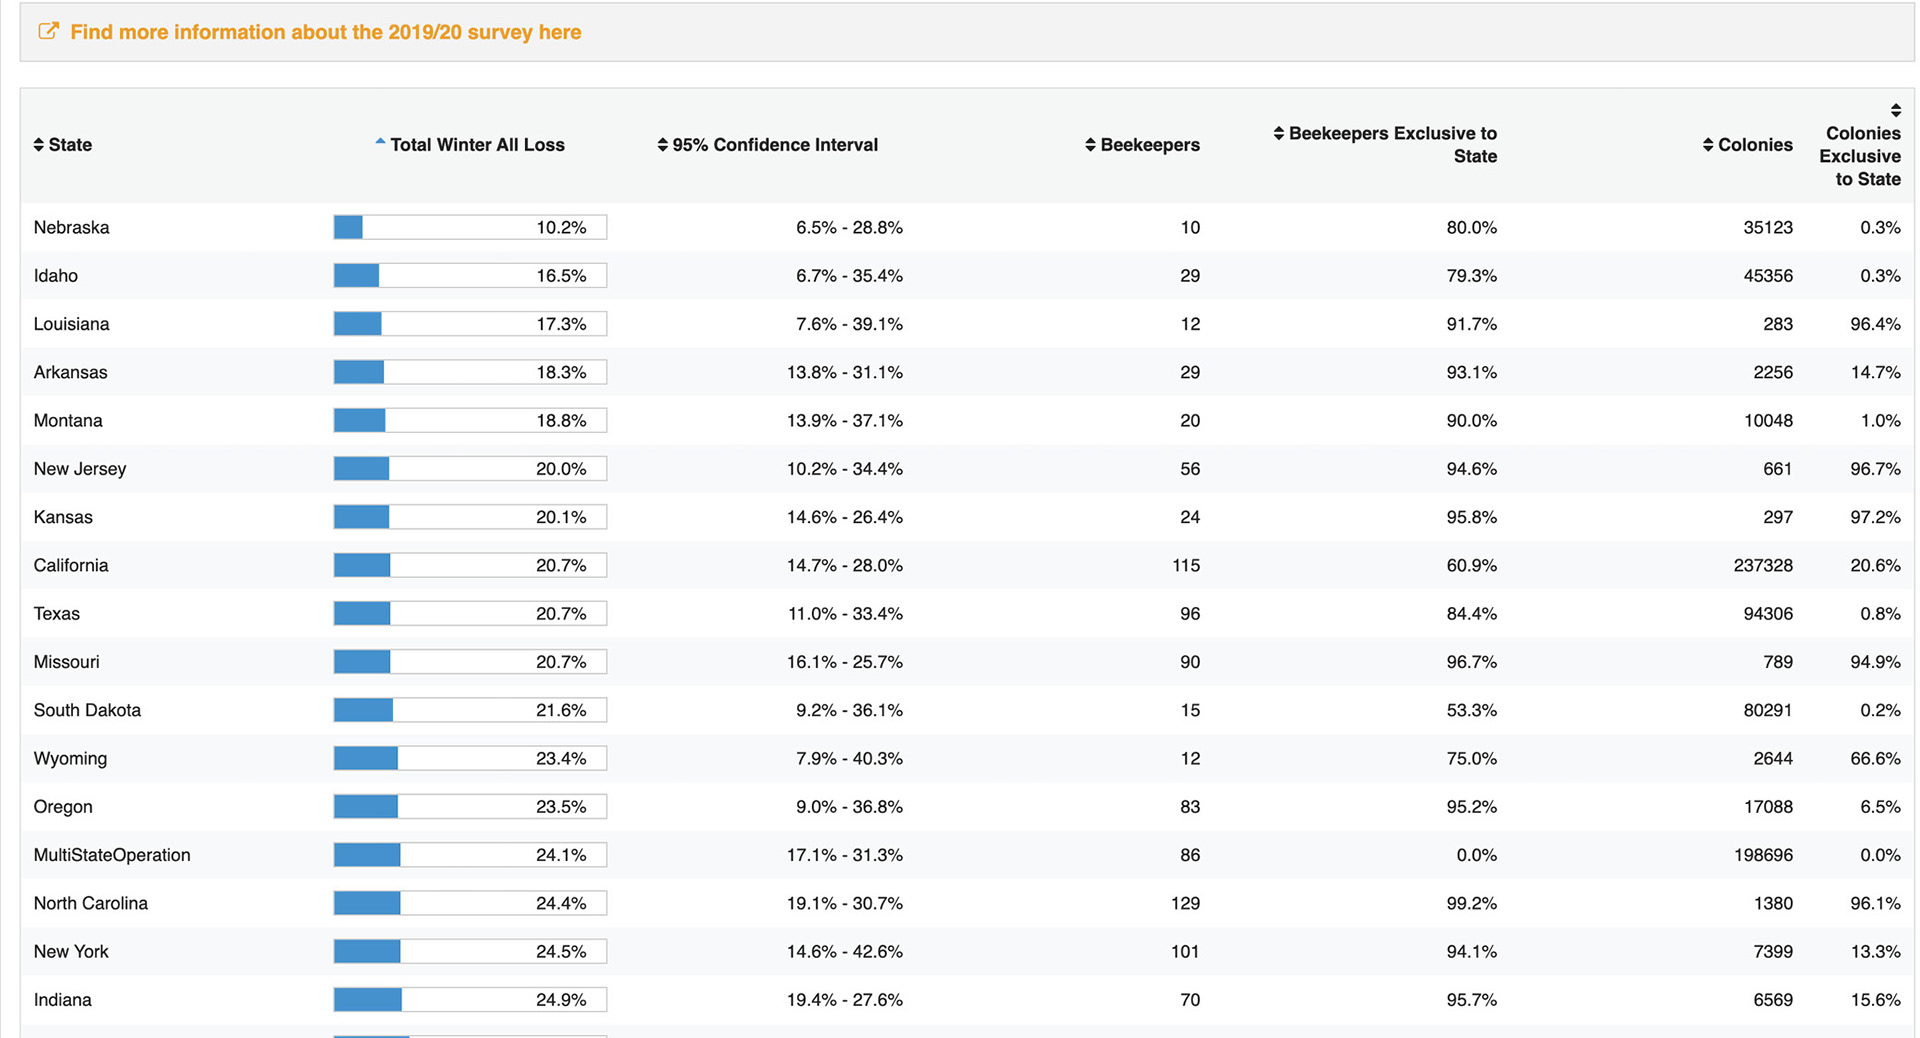
Original Makeover Monday Data dashboard
The original dashboard on the Makeover Monday site was very plain and threw a large amount of data out to the viewer at one time. This original version needed to be turned into a story that was digestable in chunks and a piece that had
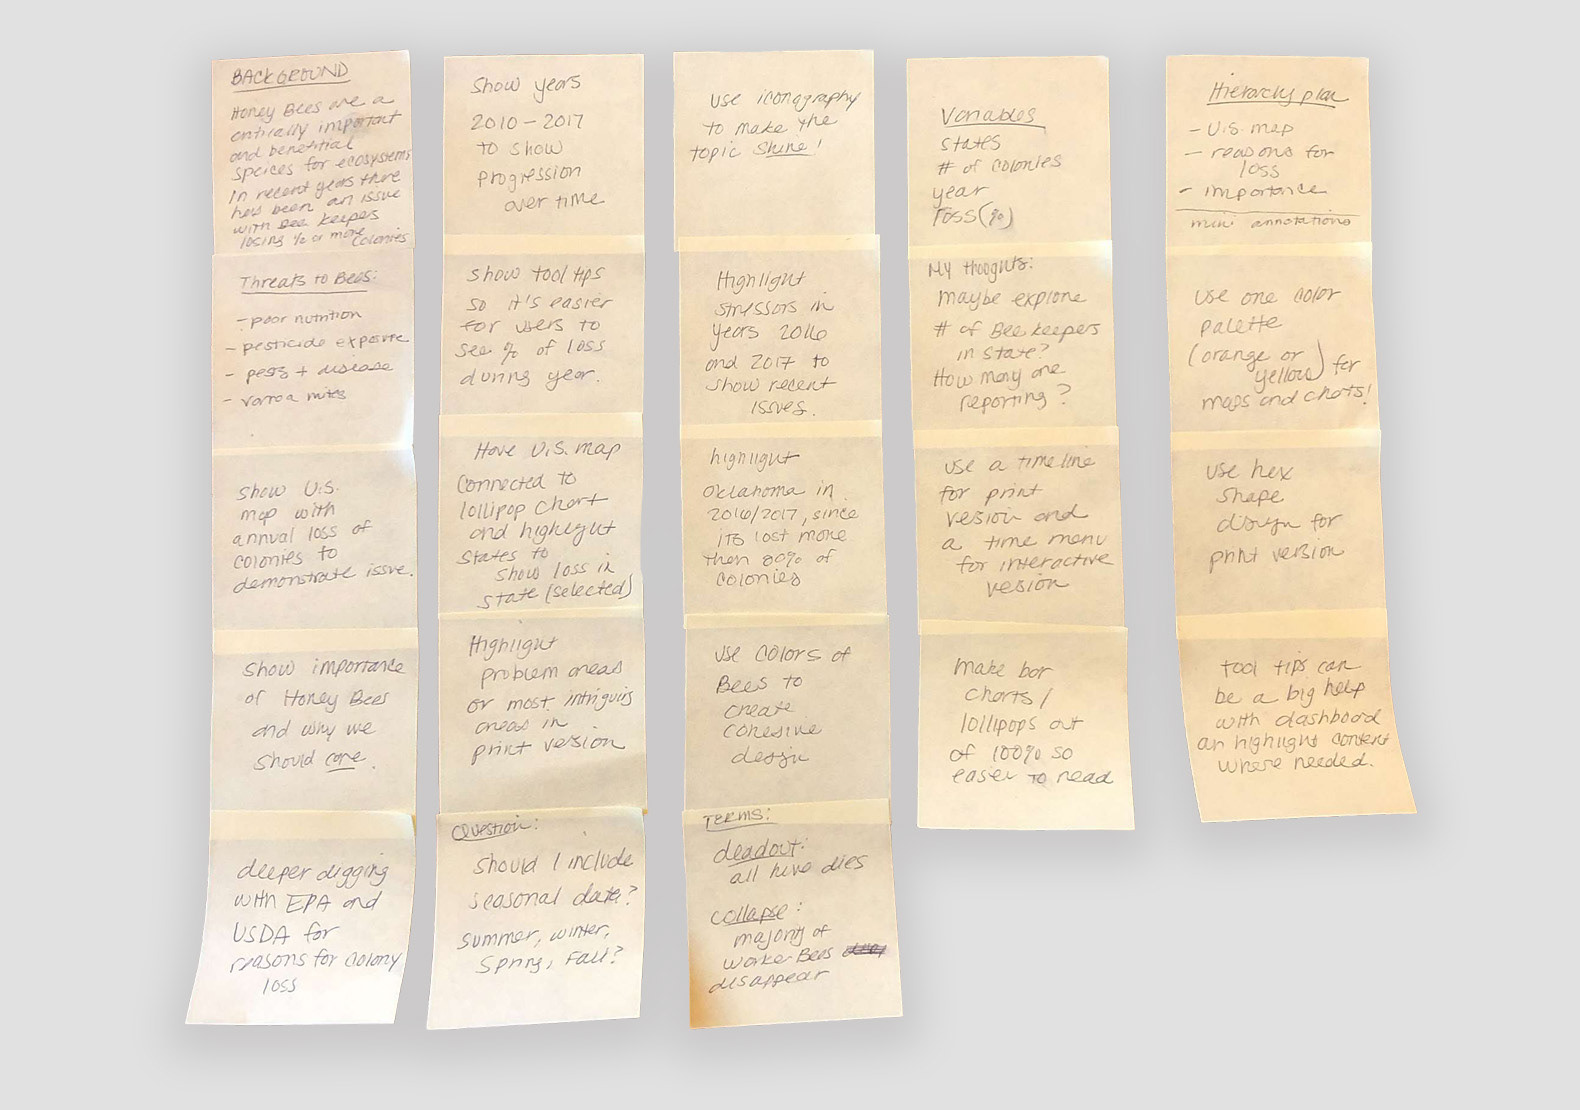
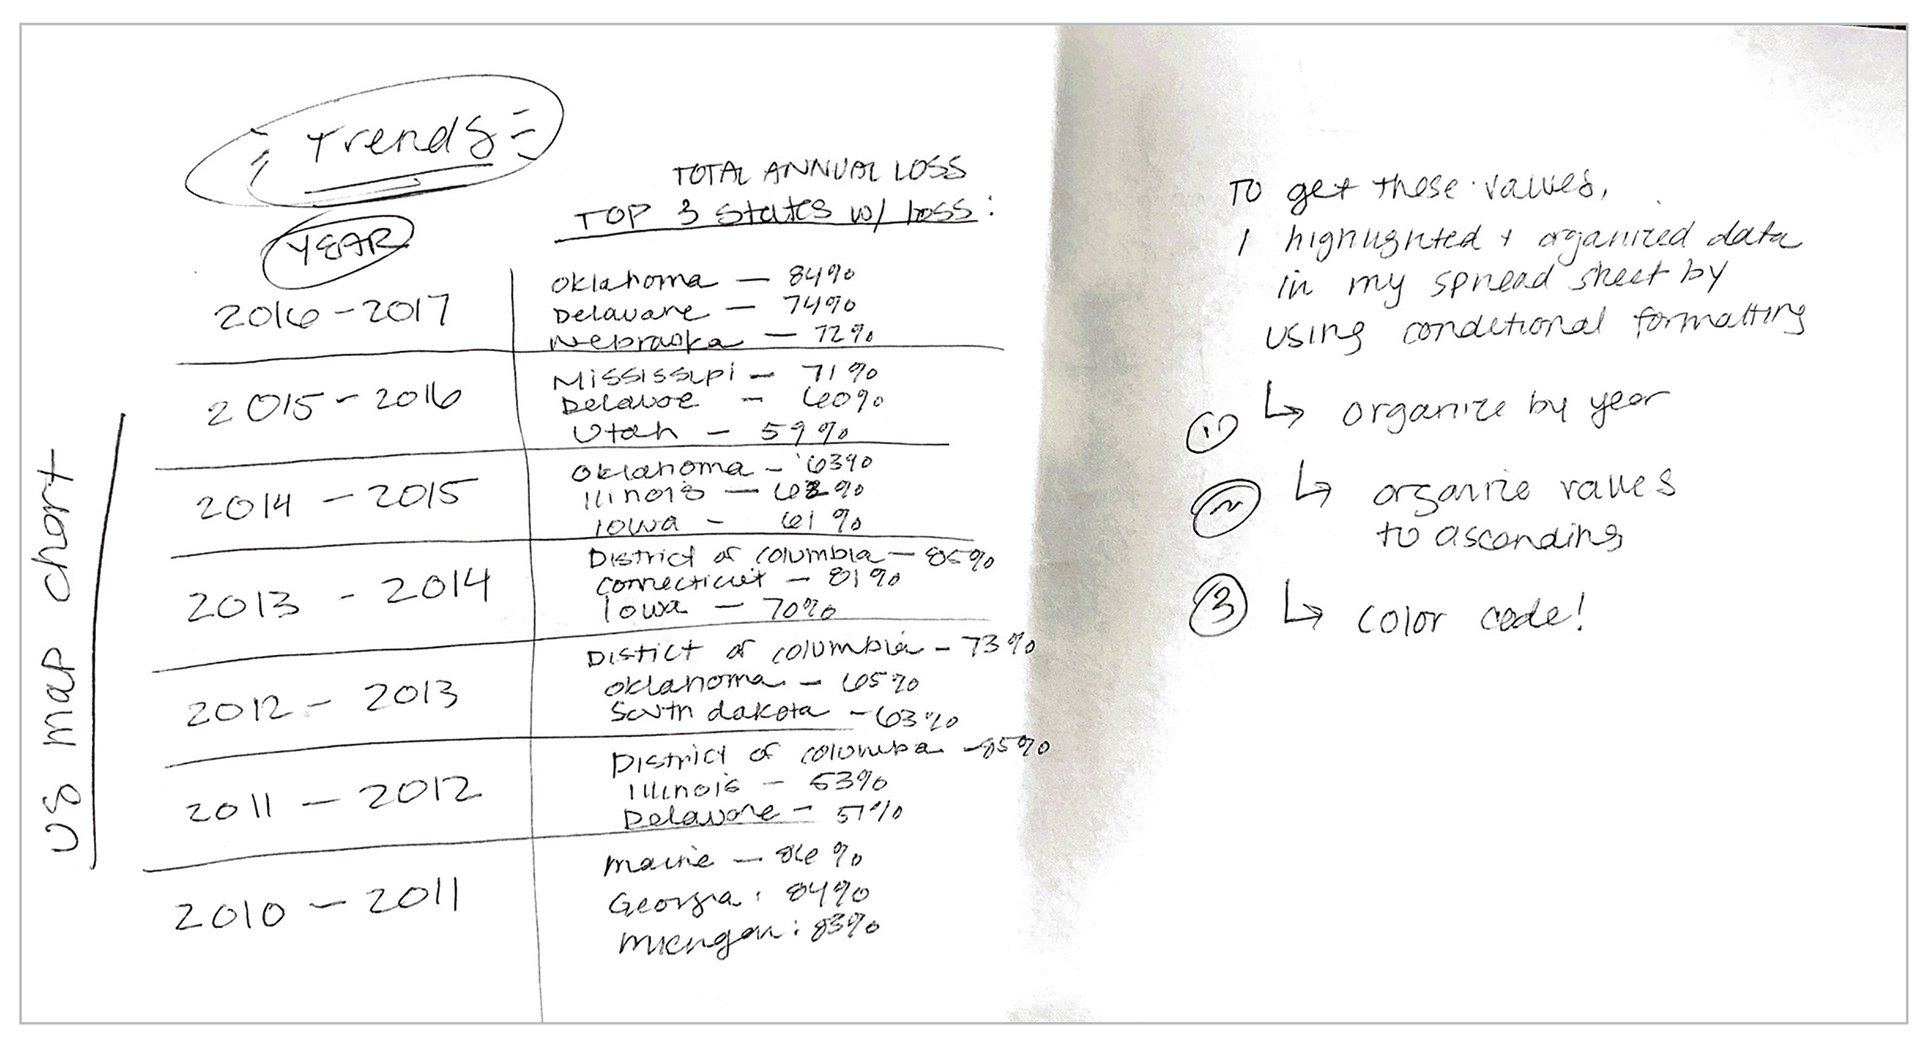
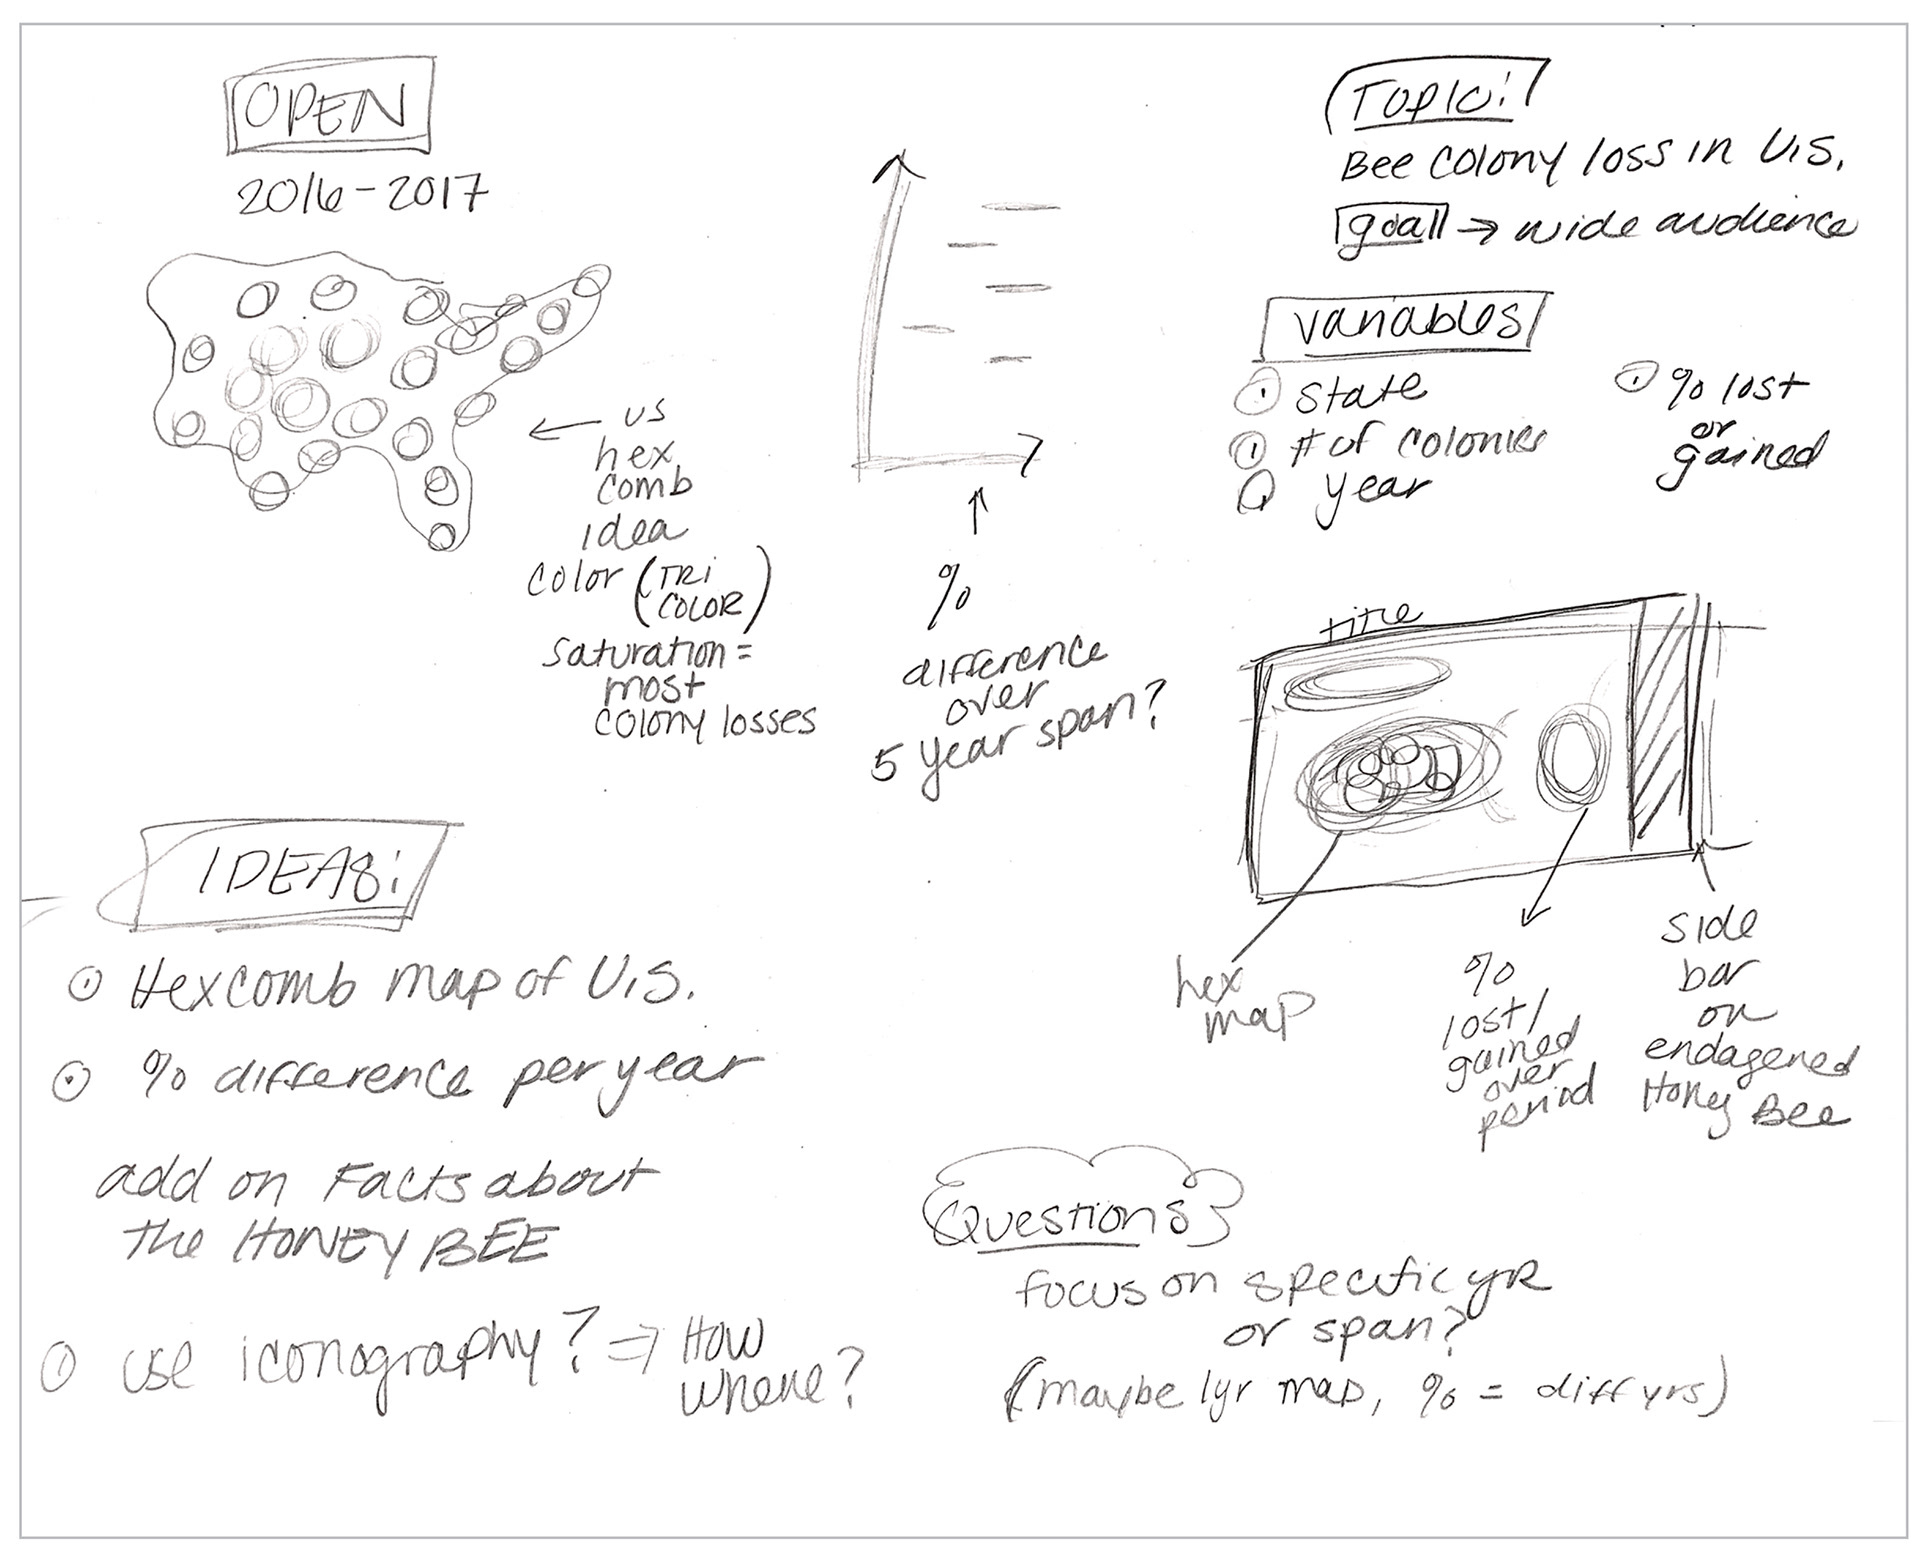
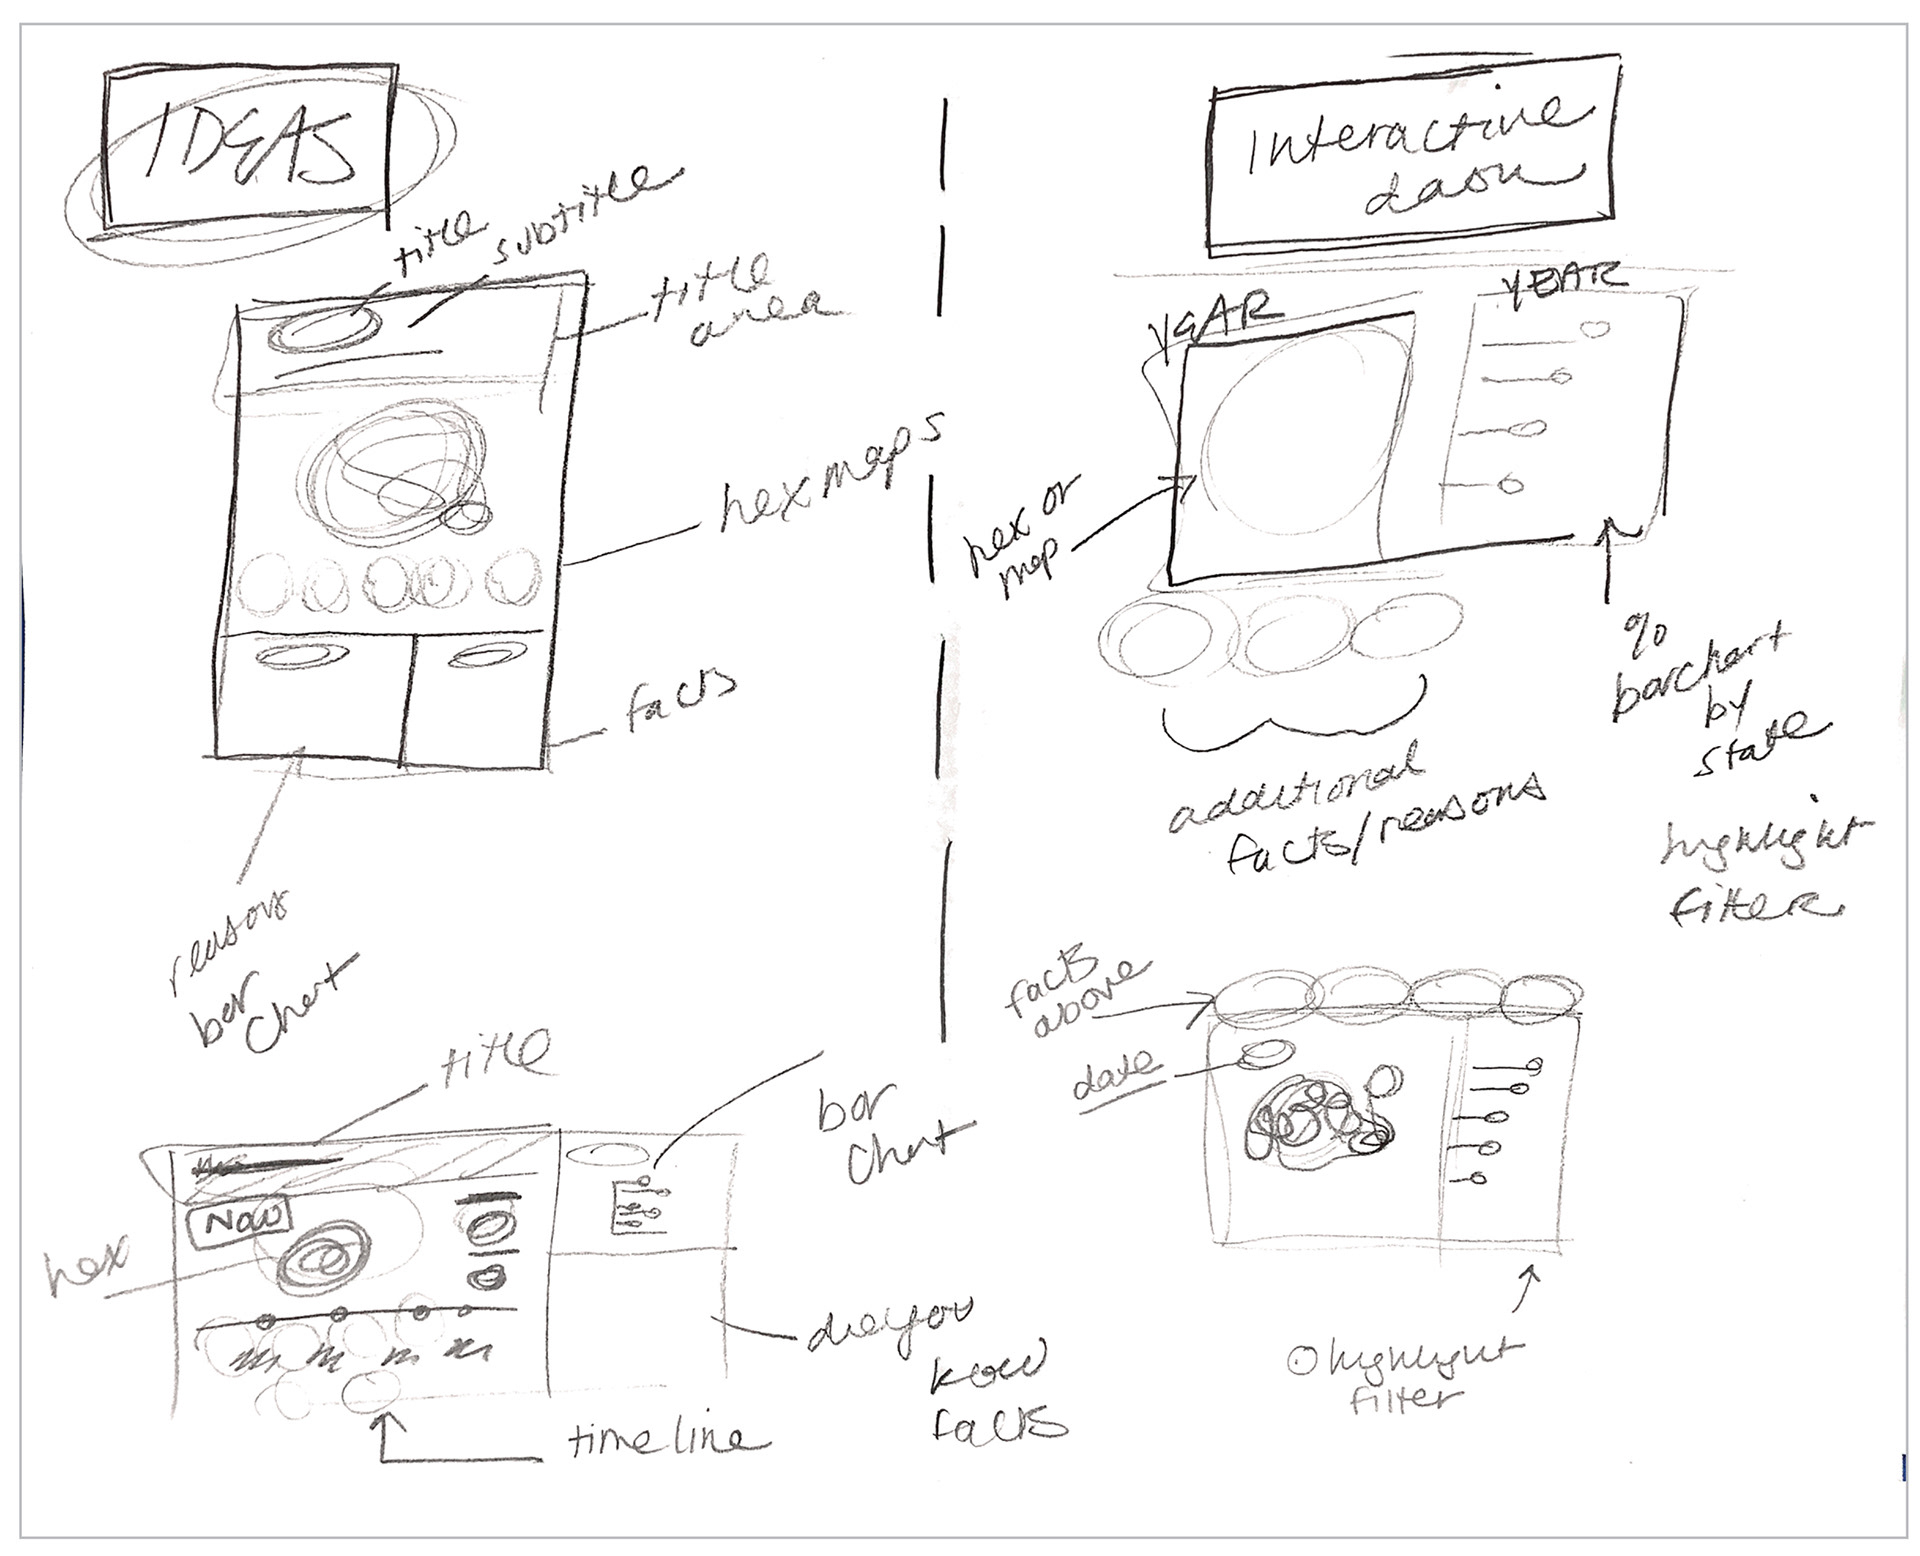
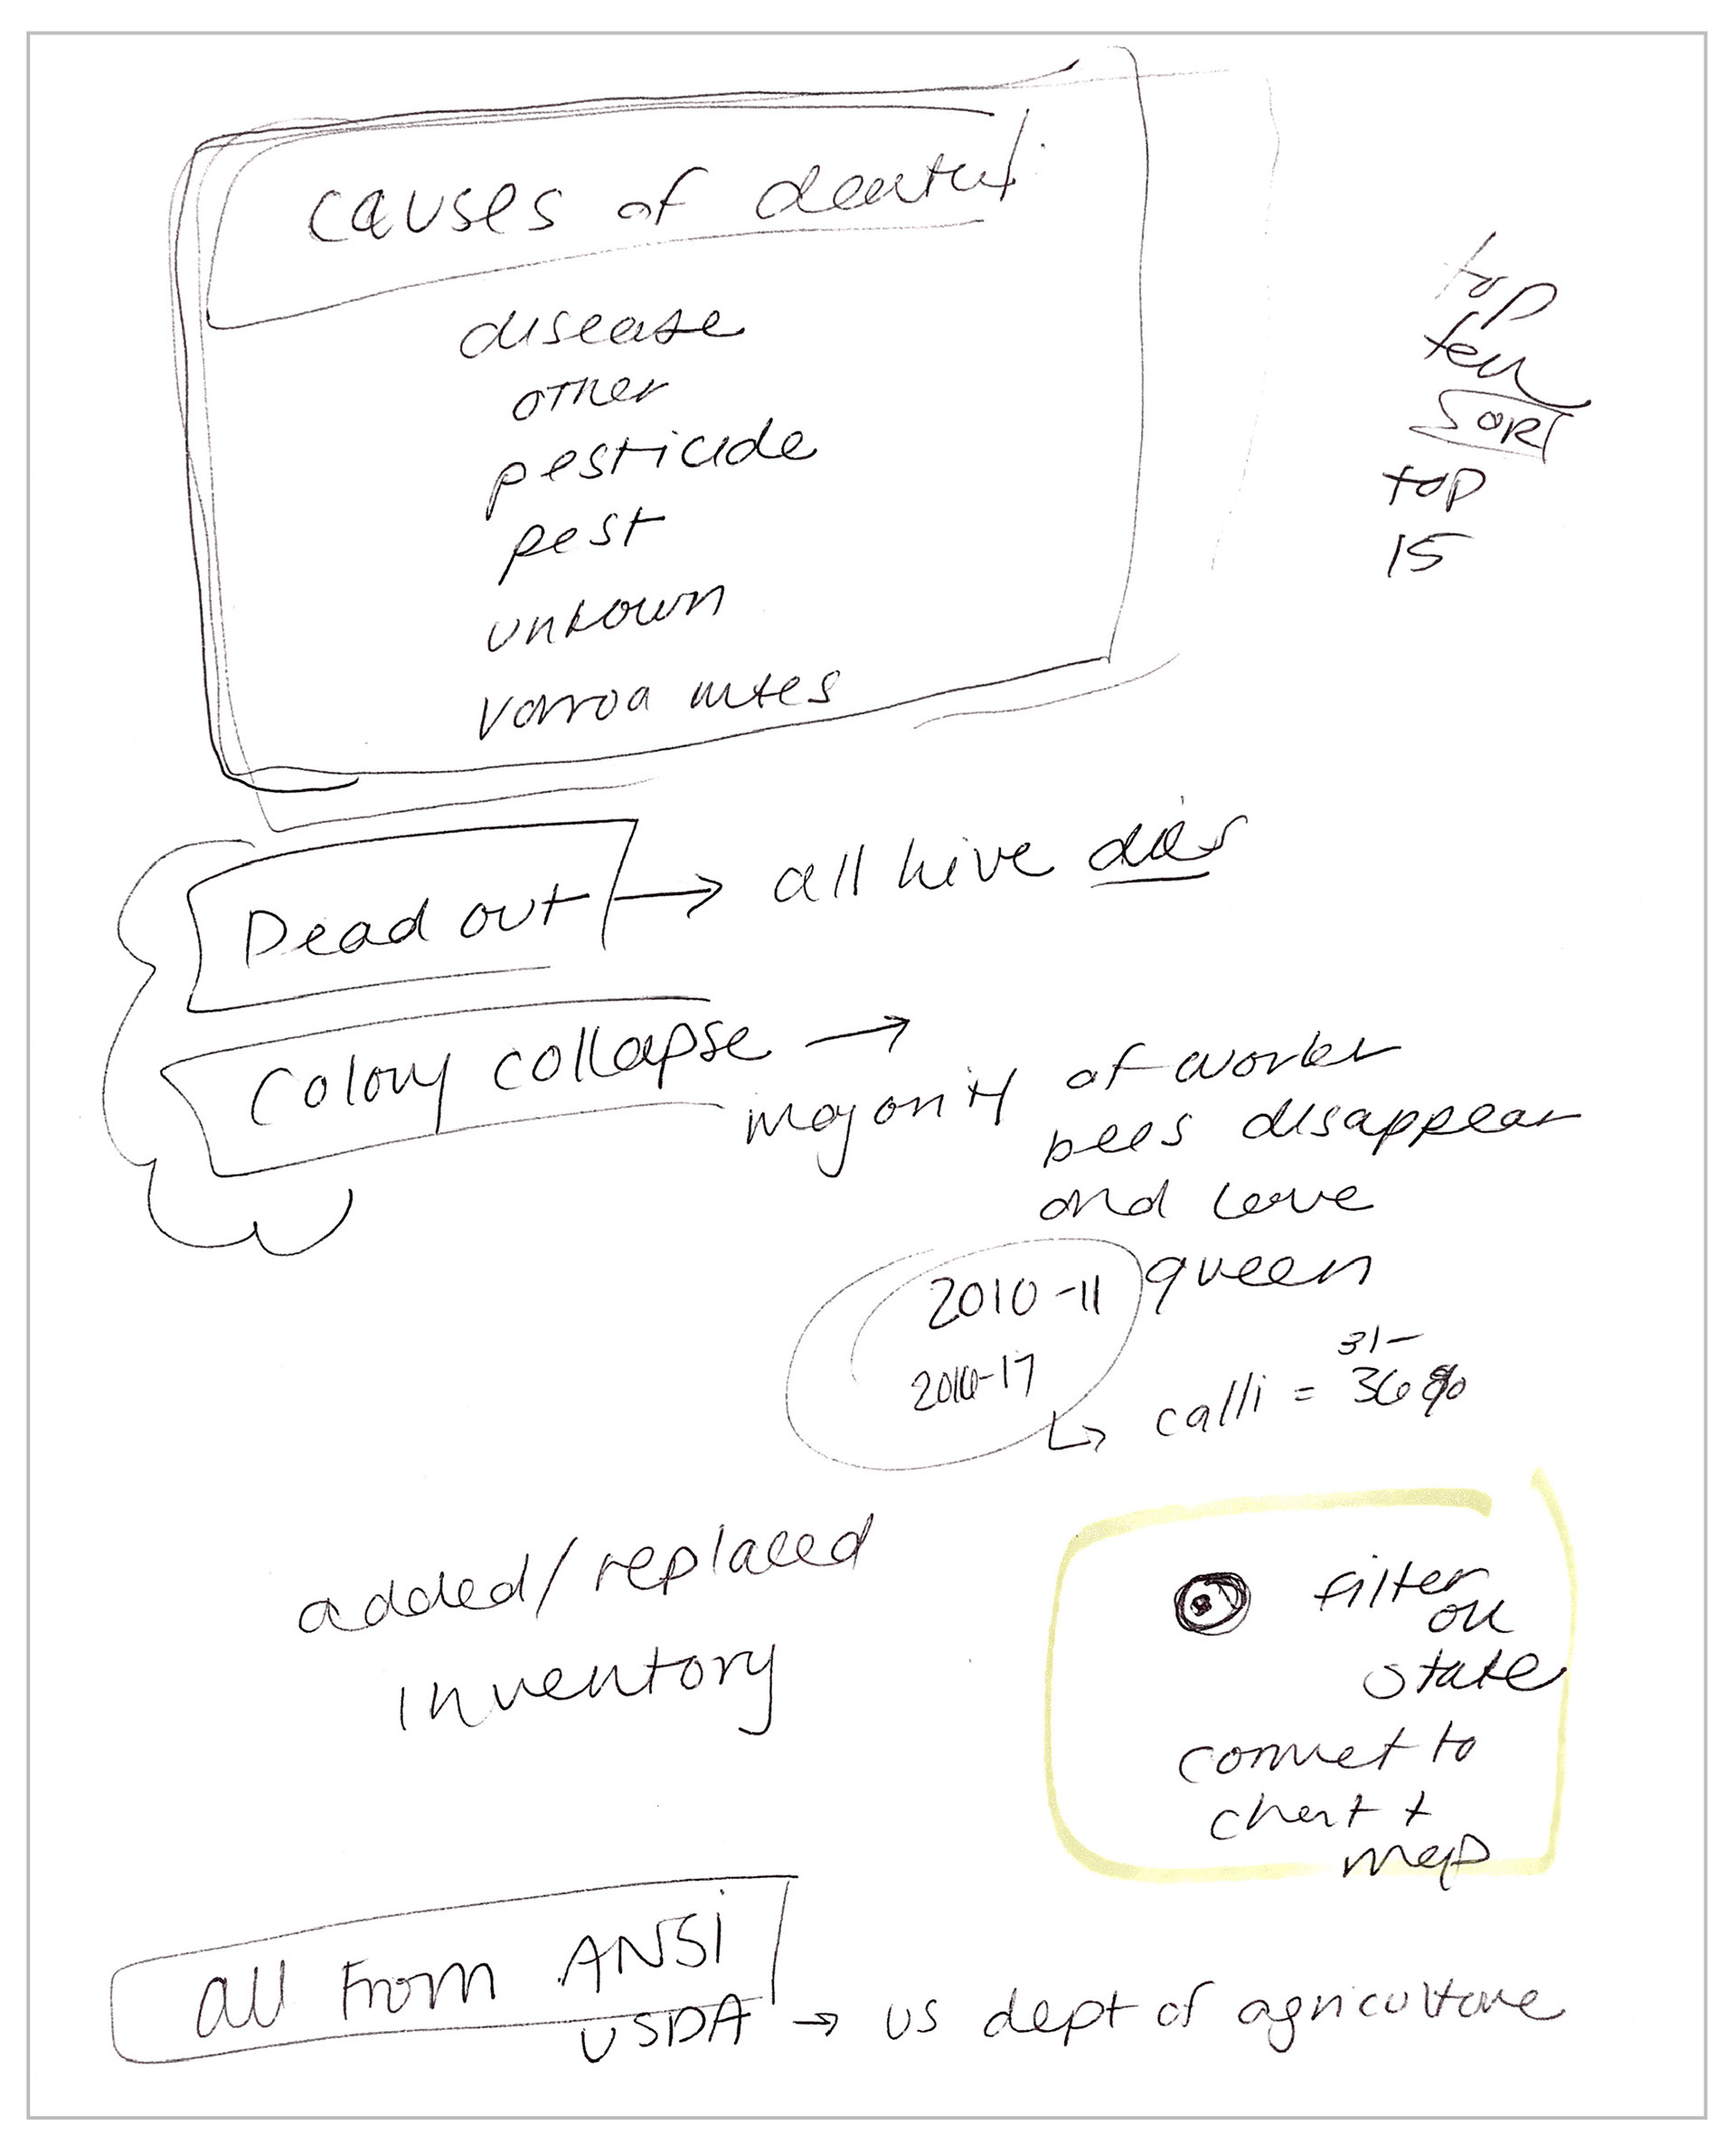
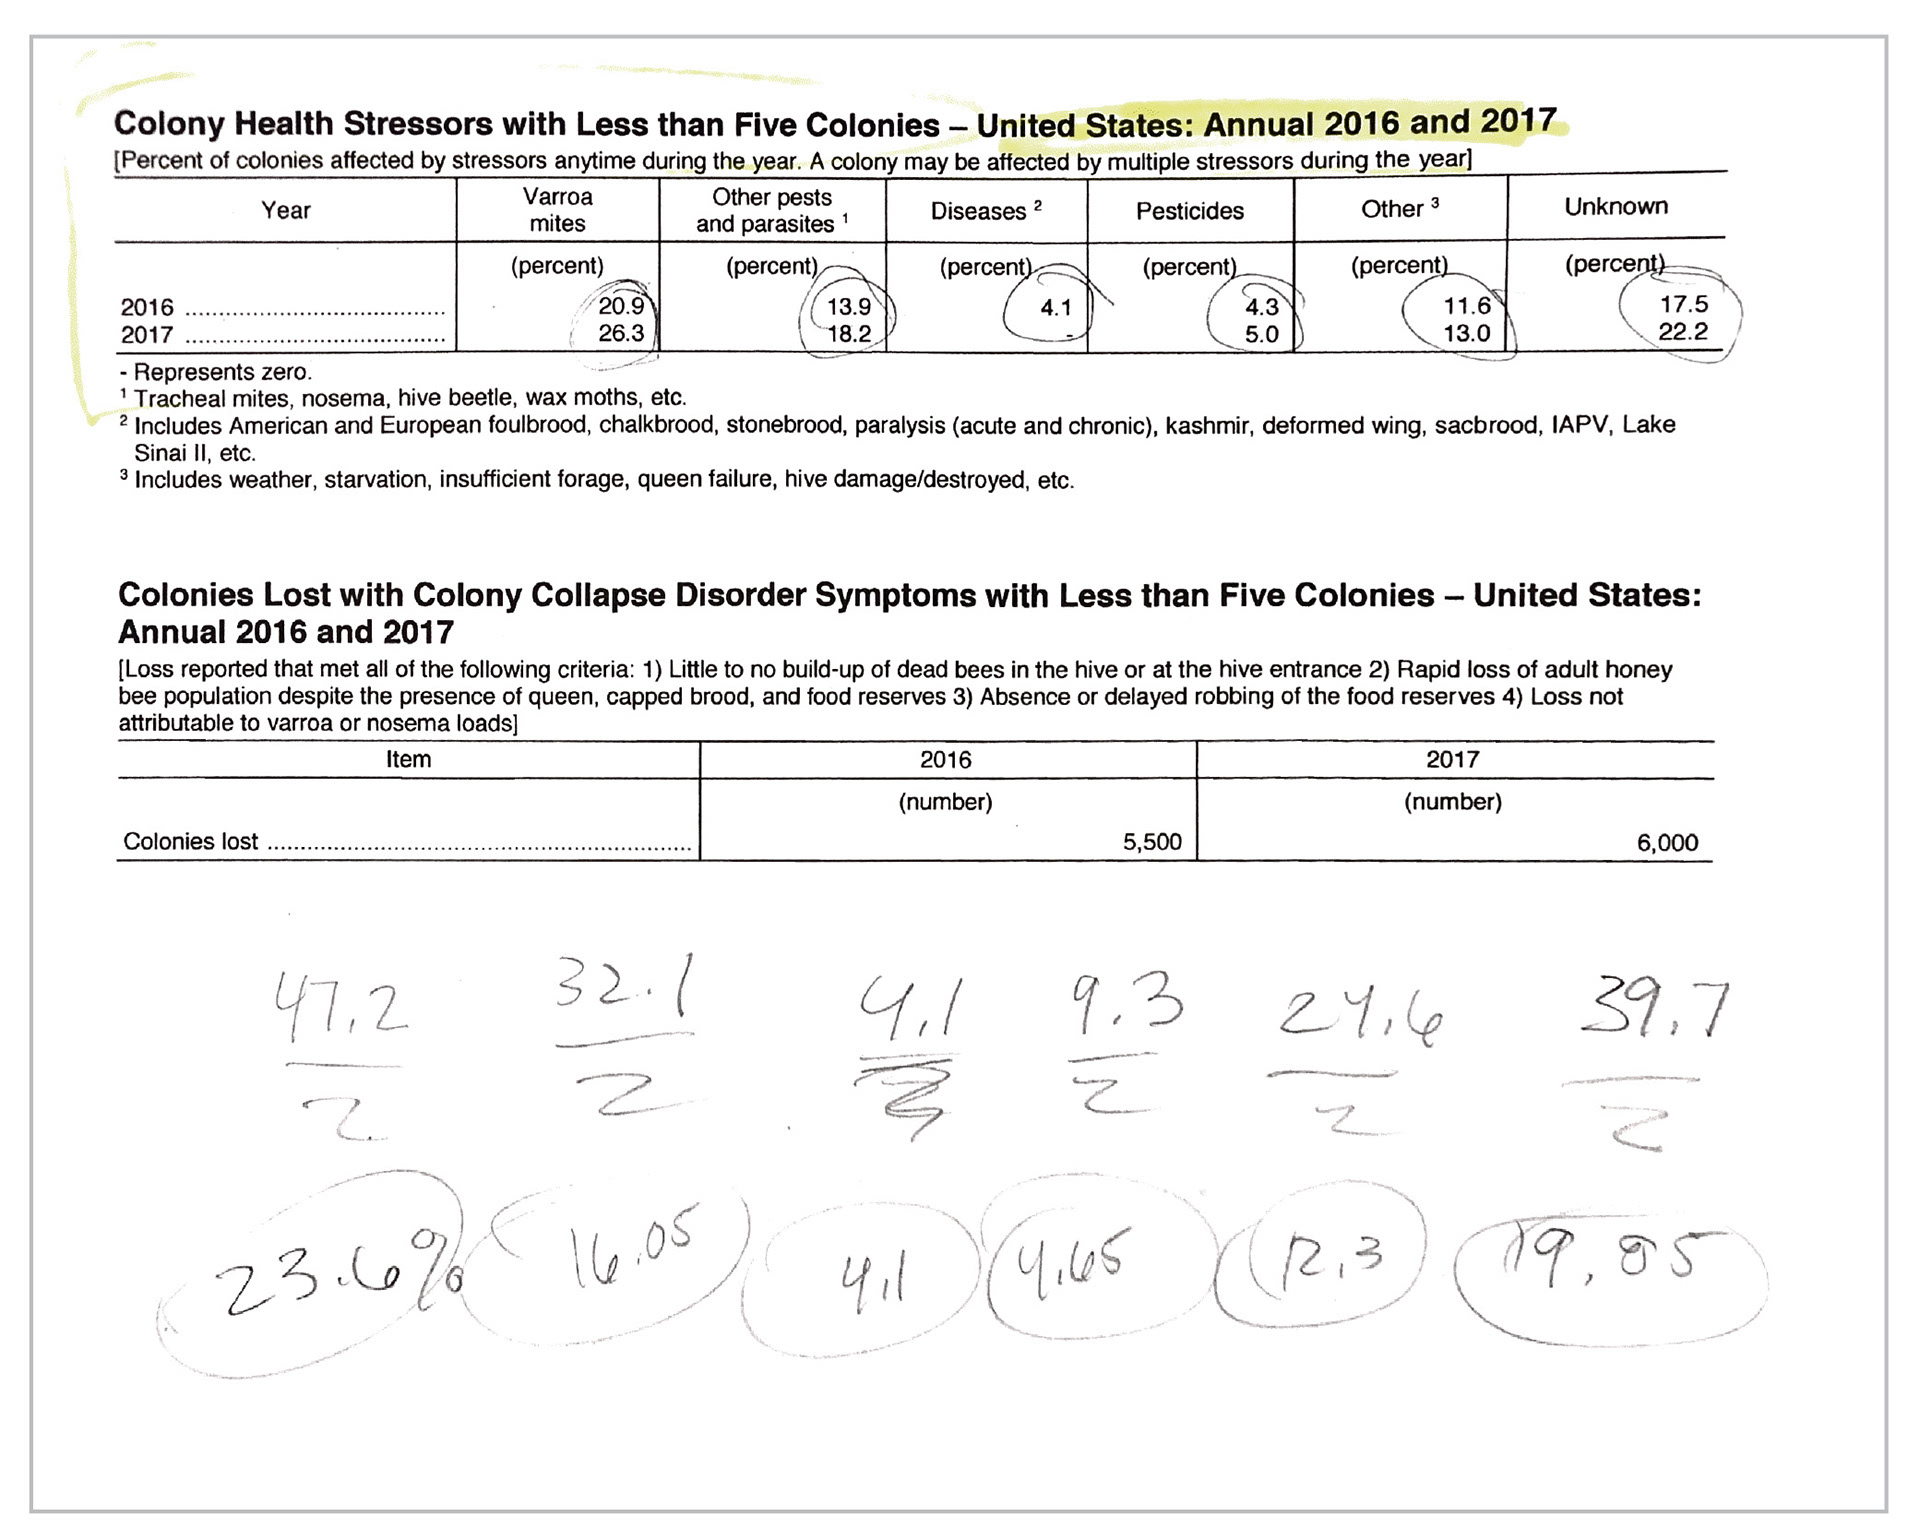
Storyboarding and Sketching
The following sketches and notes show my process of sorting and organizing data as well as planning a redesign of the dashboard in both print and interactive platforms. Analog sketches, storyboarding with sticky notes, and exploring additional data sets from the United States Department of Agriculture were a critical step when trying to create a compelling story from the data. After sketching, I organized data in Google Sheets and continued to build the project in Tableau and InDesign .